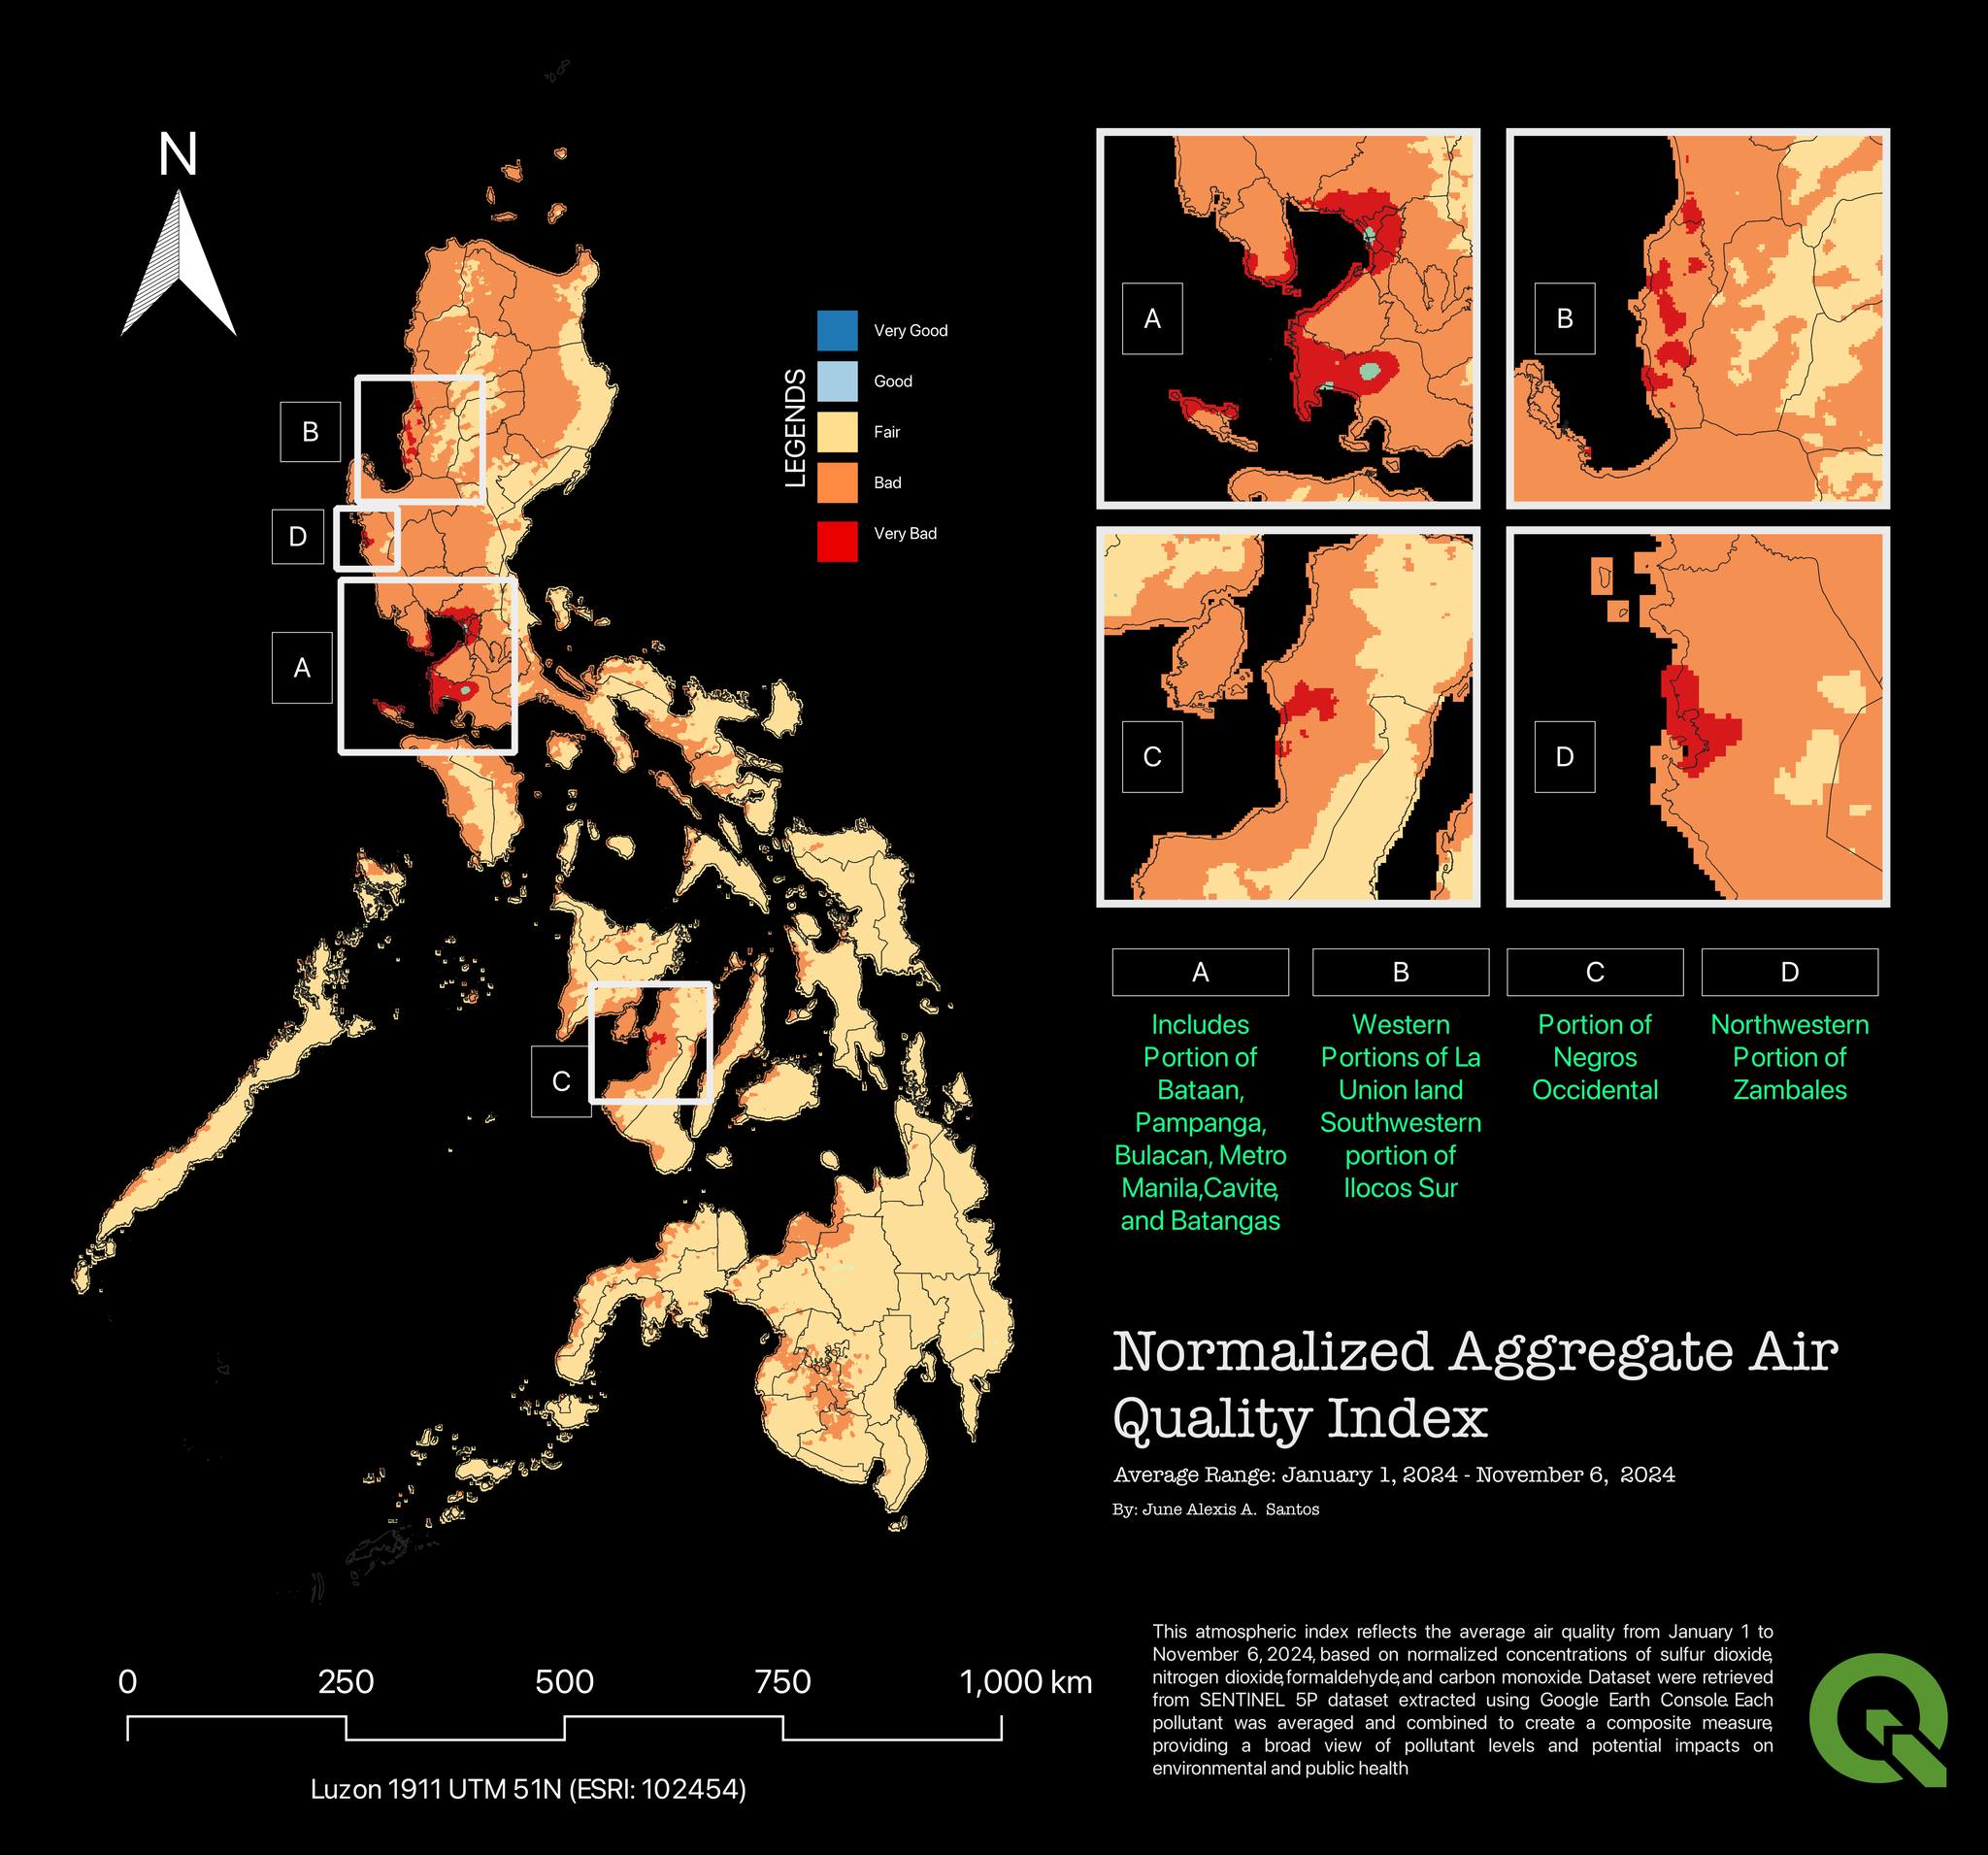
Air Quality Index Model using MCDA
Raster has always been my favorite data type to work with. For this entry, I created an Air Quality Index (AQI) map using four Sentinel-5P datasets: Sulfur Dioxide (SO₂), Nitrogen Dioxide (NO₂), Formaldehyde (HCHO), and Carbon Monoxide (CO). With the help of Google Earth Engine and Multi-Criteria Decision Analysis (MCDA), I extracted the mean values of each pollutant over the course of the year, then applied batch normalization to standardize the data. The normalized rasters were aggregated and reclassified into five categories to represent varying levels of air quality. The result includes four overview maps highlighting long-term exposure to atmospheric pollutants.
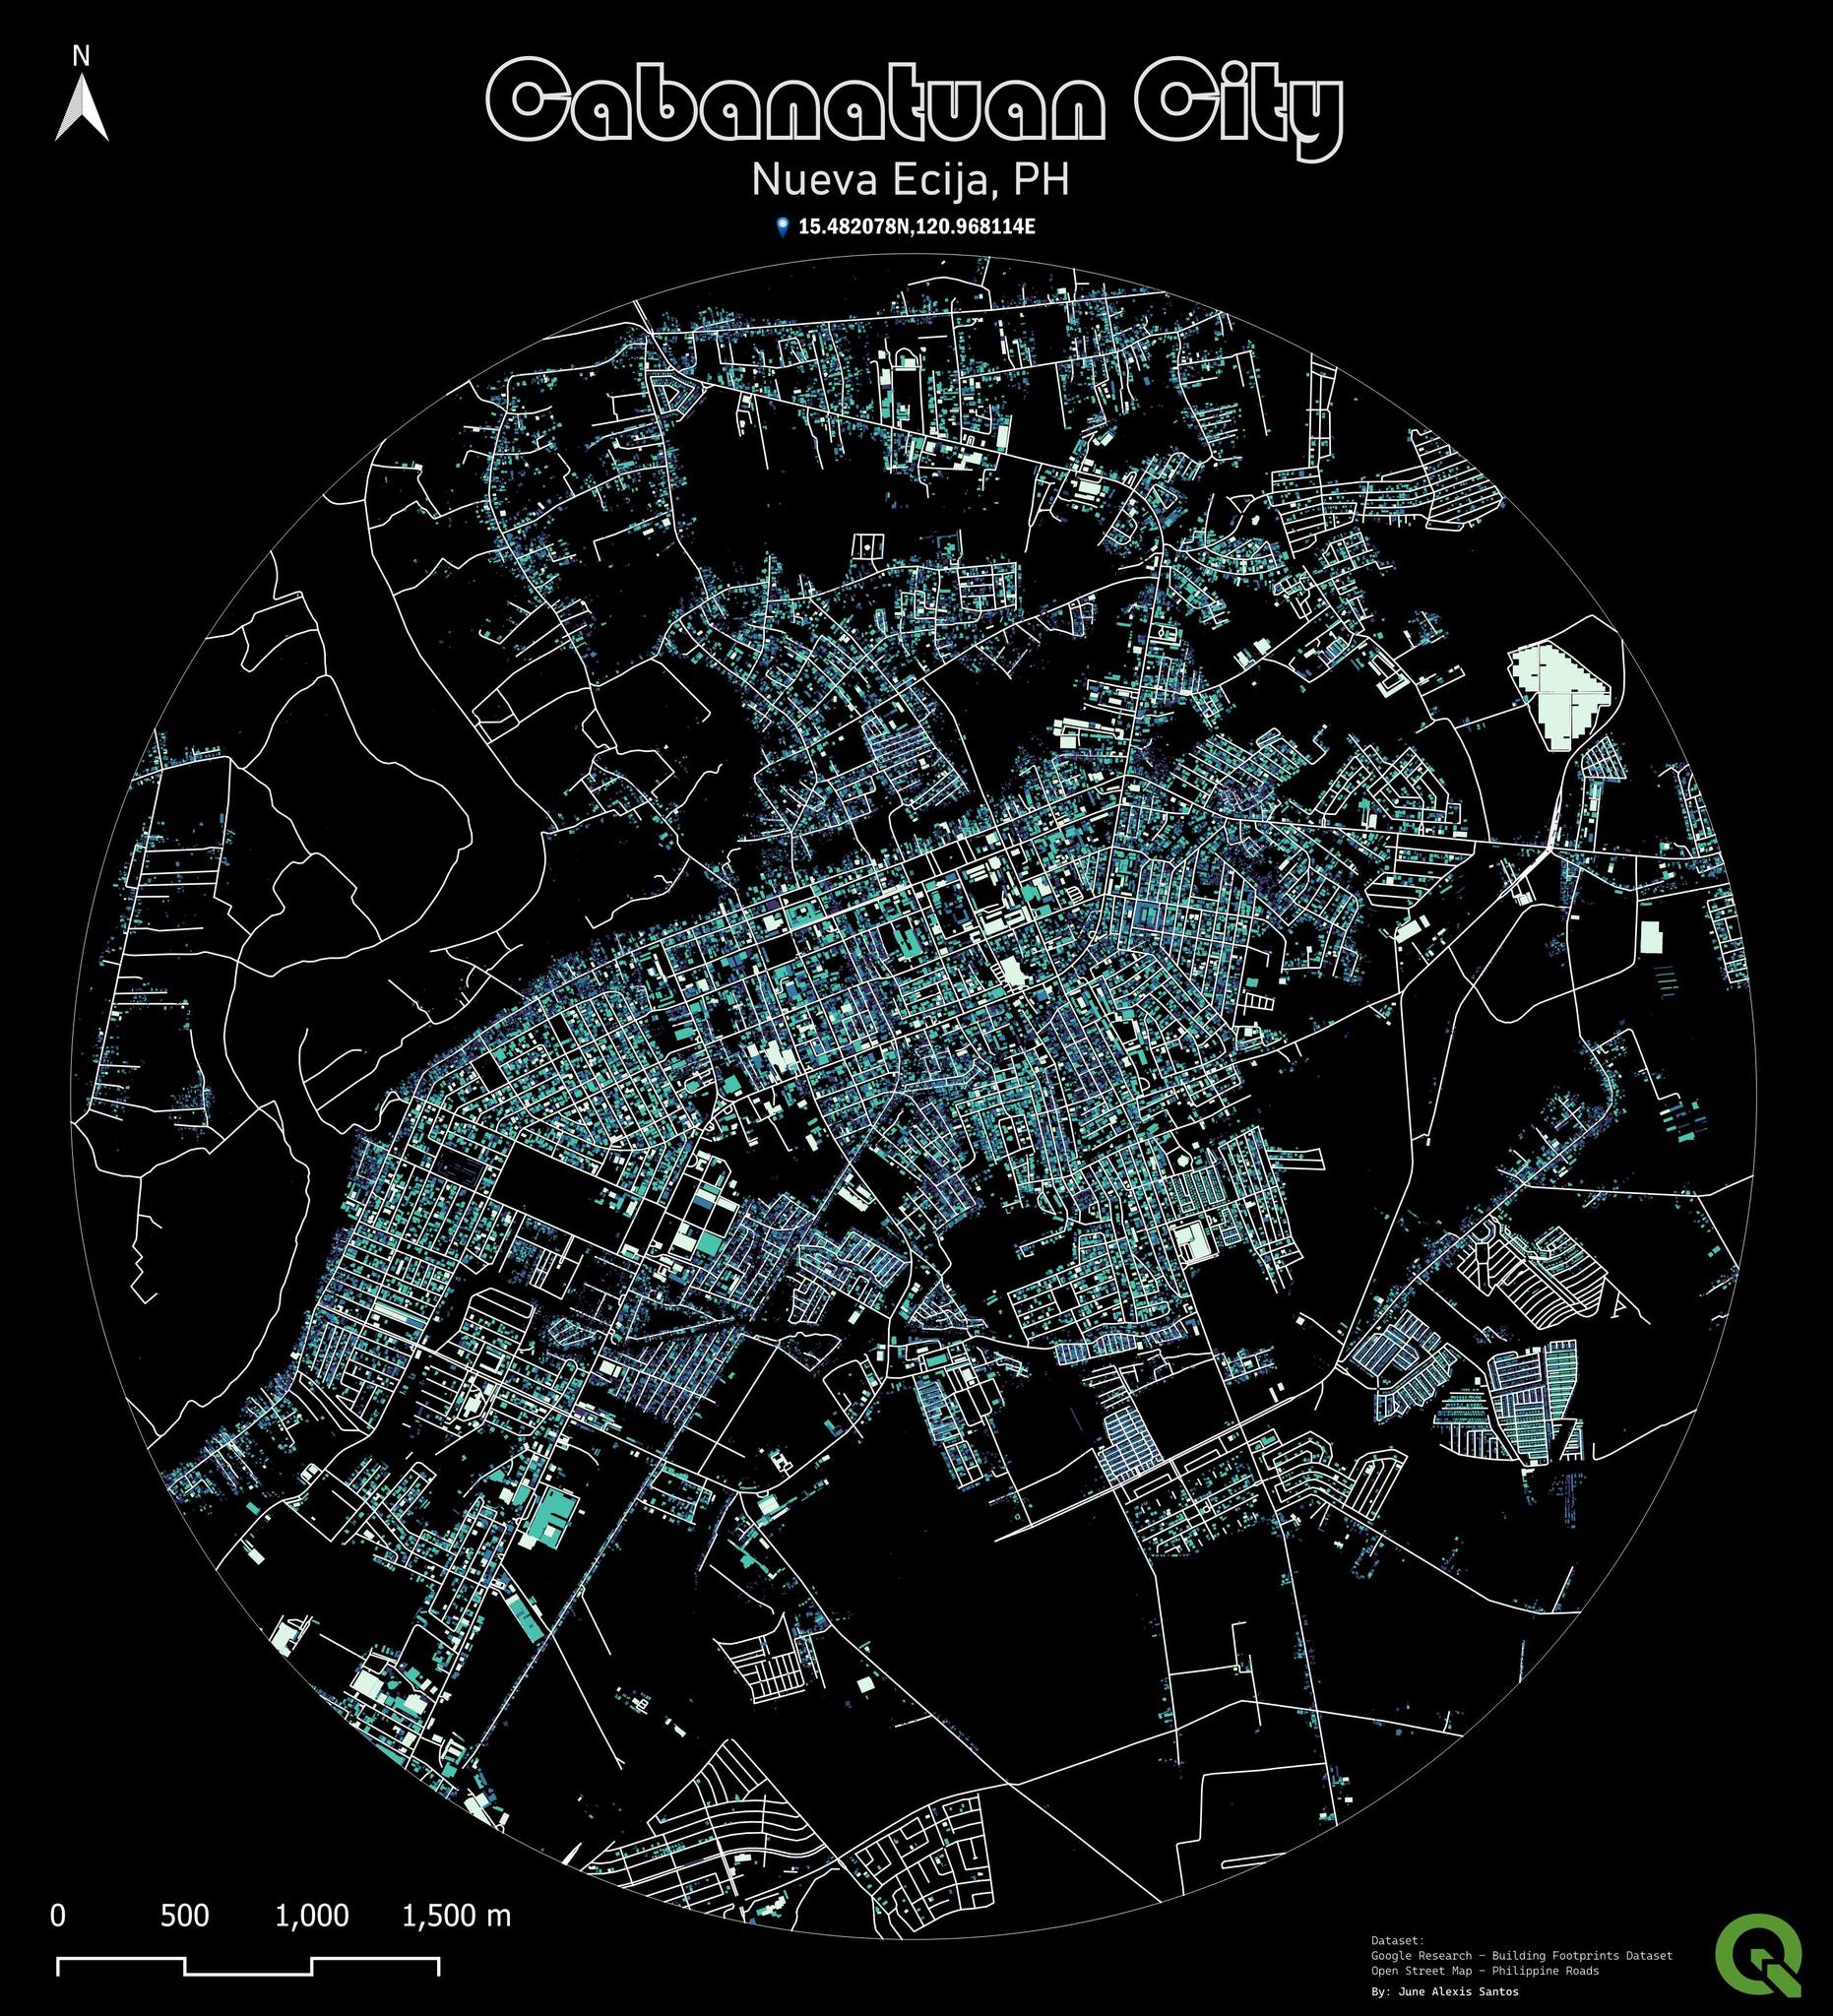
Cabanatuan City Road and Built-up Infrastructure
I live in Cabanatuan City, Nueva Ecija—a vibrant urban center with a rich historical background and a fast-paced, dynamic lifestyle. The city's rapid development is clearly visible in its expanding road networks and growing built-up areas, highlighting its vital role in regional commerce and transportation. Through this project, I aim to showcase the interconnectedness of Cabanatuan's infrastructure and capture the evolving nature of its urban landscape.
[VIDEO] Atmospheric SO₂ map ejected by Mt. Kanlaon in Negros Island, PH
This 2024 timelapse visualizes the monthly mean SO₂ levels from January to December, including data after the eruption, highlighting its impact on atmospheric air quality. The dataset—derived from Sentinel-5P SO₂ measurements—was processed using the Google Earth Engine Console.
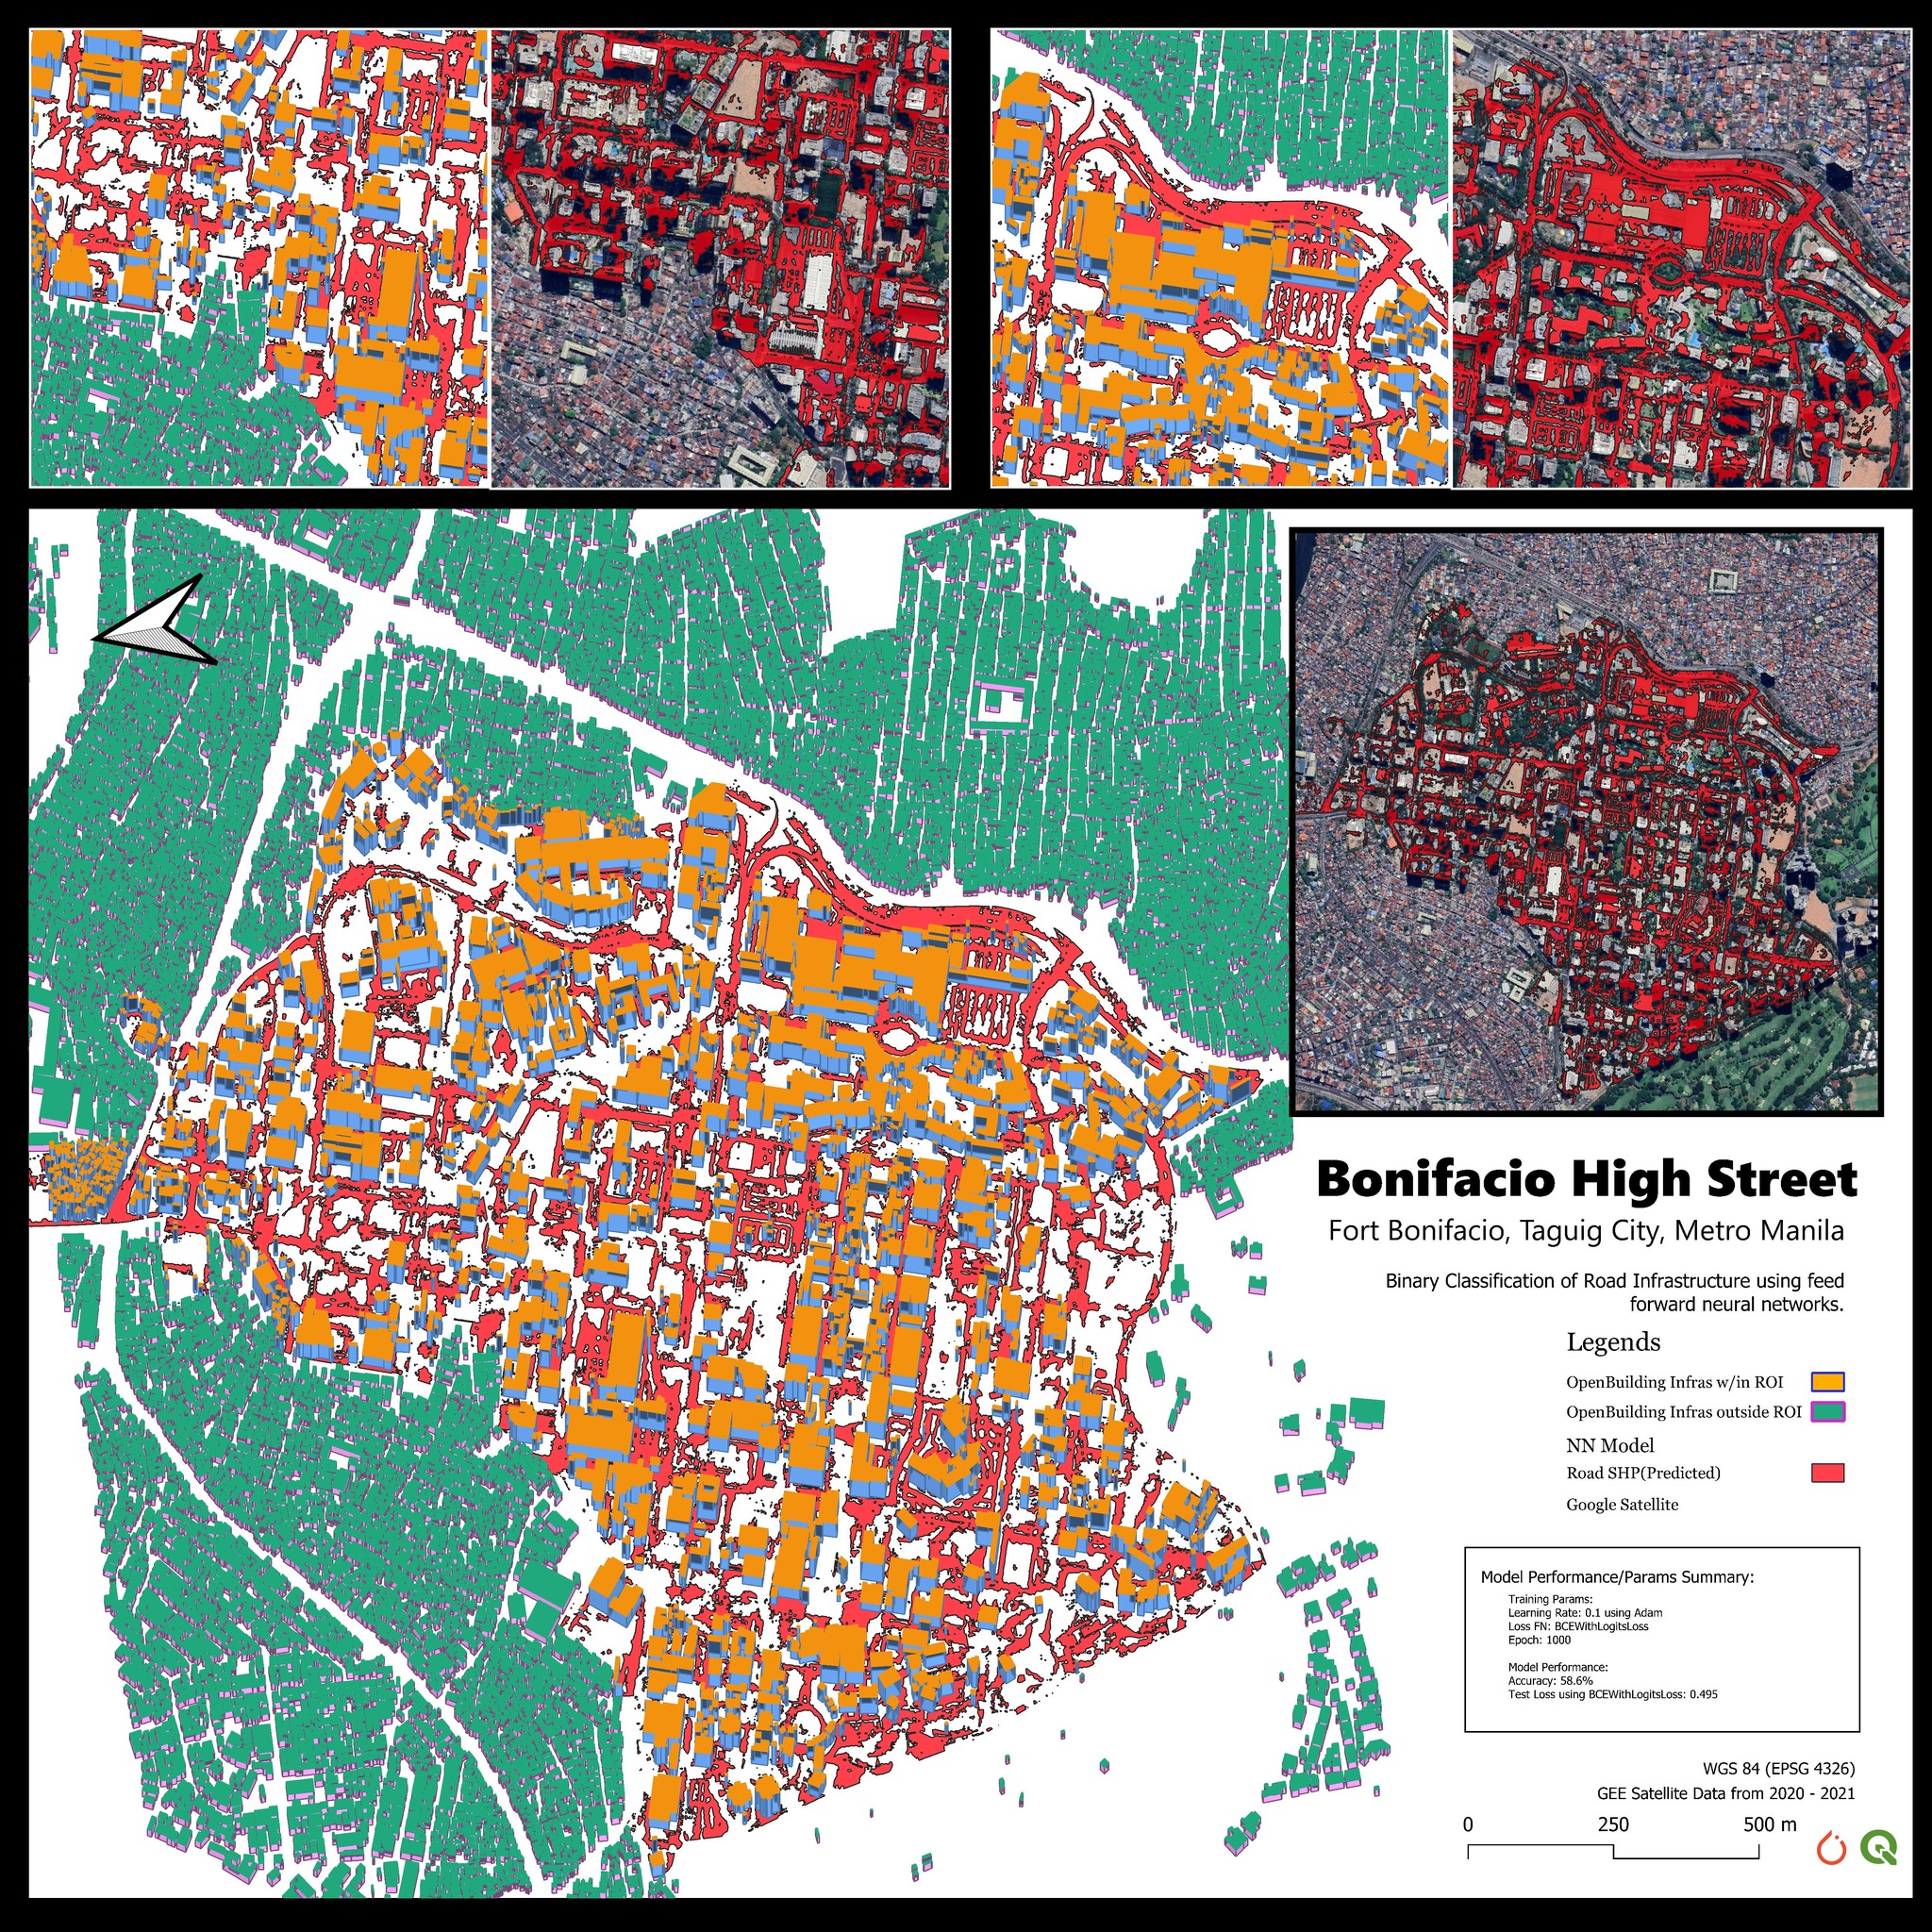
Binary Classification of Road Infras from Satellite Image using Machine Learning Identification Method
In this project, I employed a simple feedforward neural network (FFNN) to analyze satellite imagery, treating the 2D datasets as structured data frames. Spectral signatures from Sentinel-2 bands—extracted via Google Earth Engine—were used to generate features, which were then flattened into tensor arrays. The data was semi-automatically labeled to facilitate supervised learning. After training and optimizing the model, I developed a PyTorch-based workflow that involved reshaping the output to match the original spatial dimensions and georeferencing the results using Rasterio and GeoPandas. The final output was visualized as a 2.5D map in QGIS. Although the model's accuracy was not optimal, the project proved to be a valuable learning experience. While more advanced architectures like U-Net or other CNNs may perform better on spatial data, this work laid a strong foundation for future exploration in geospatial deep learning.
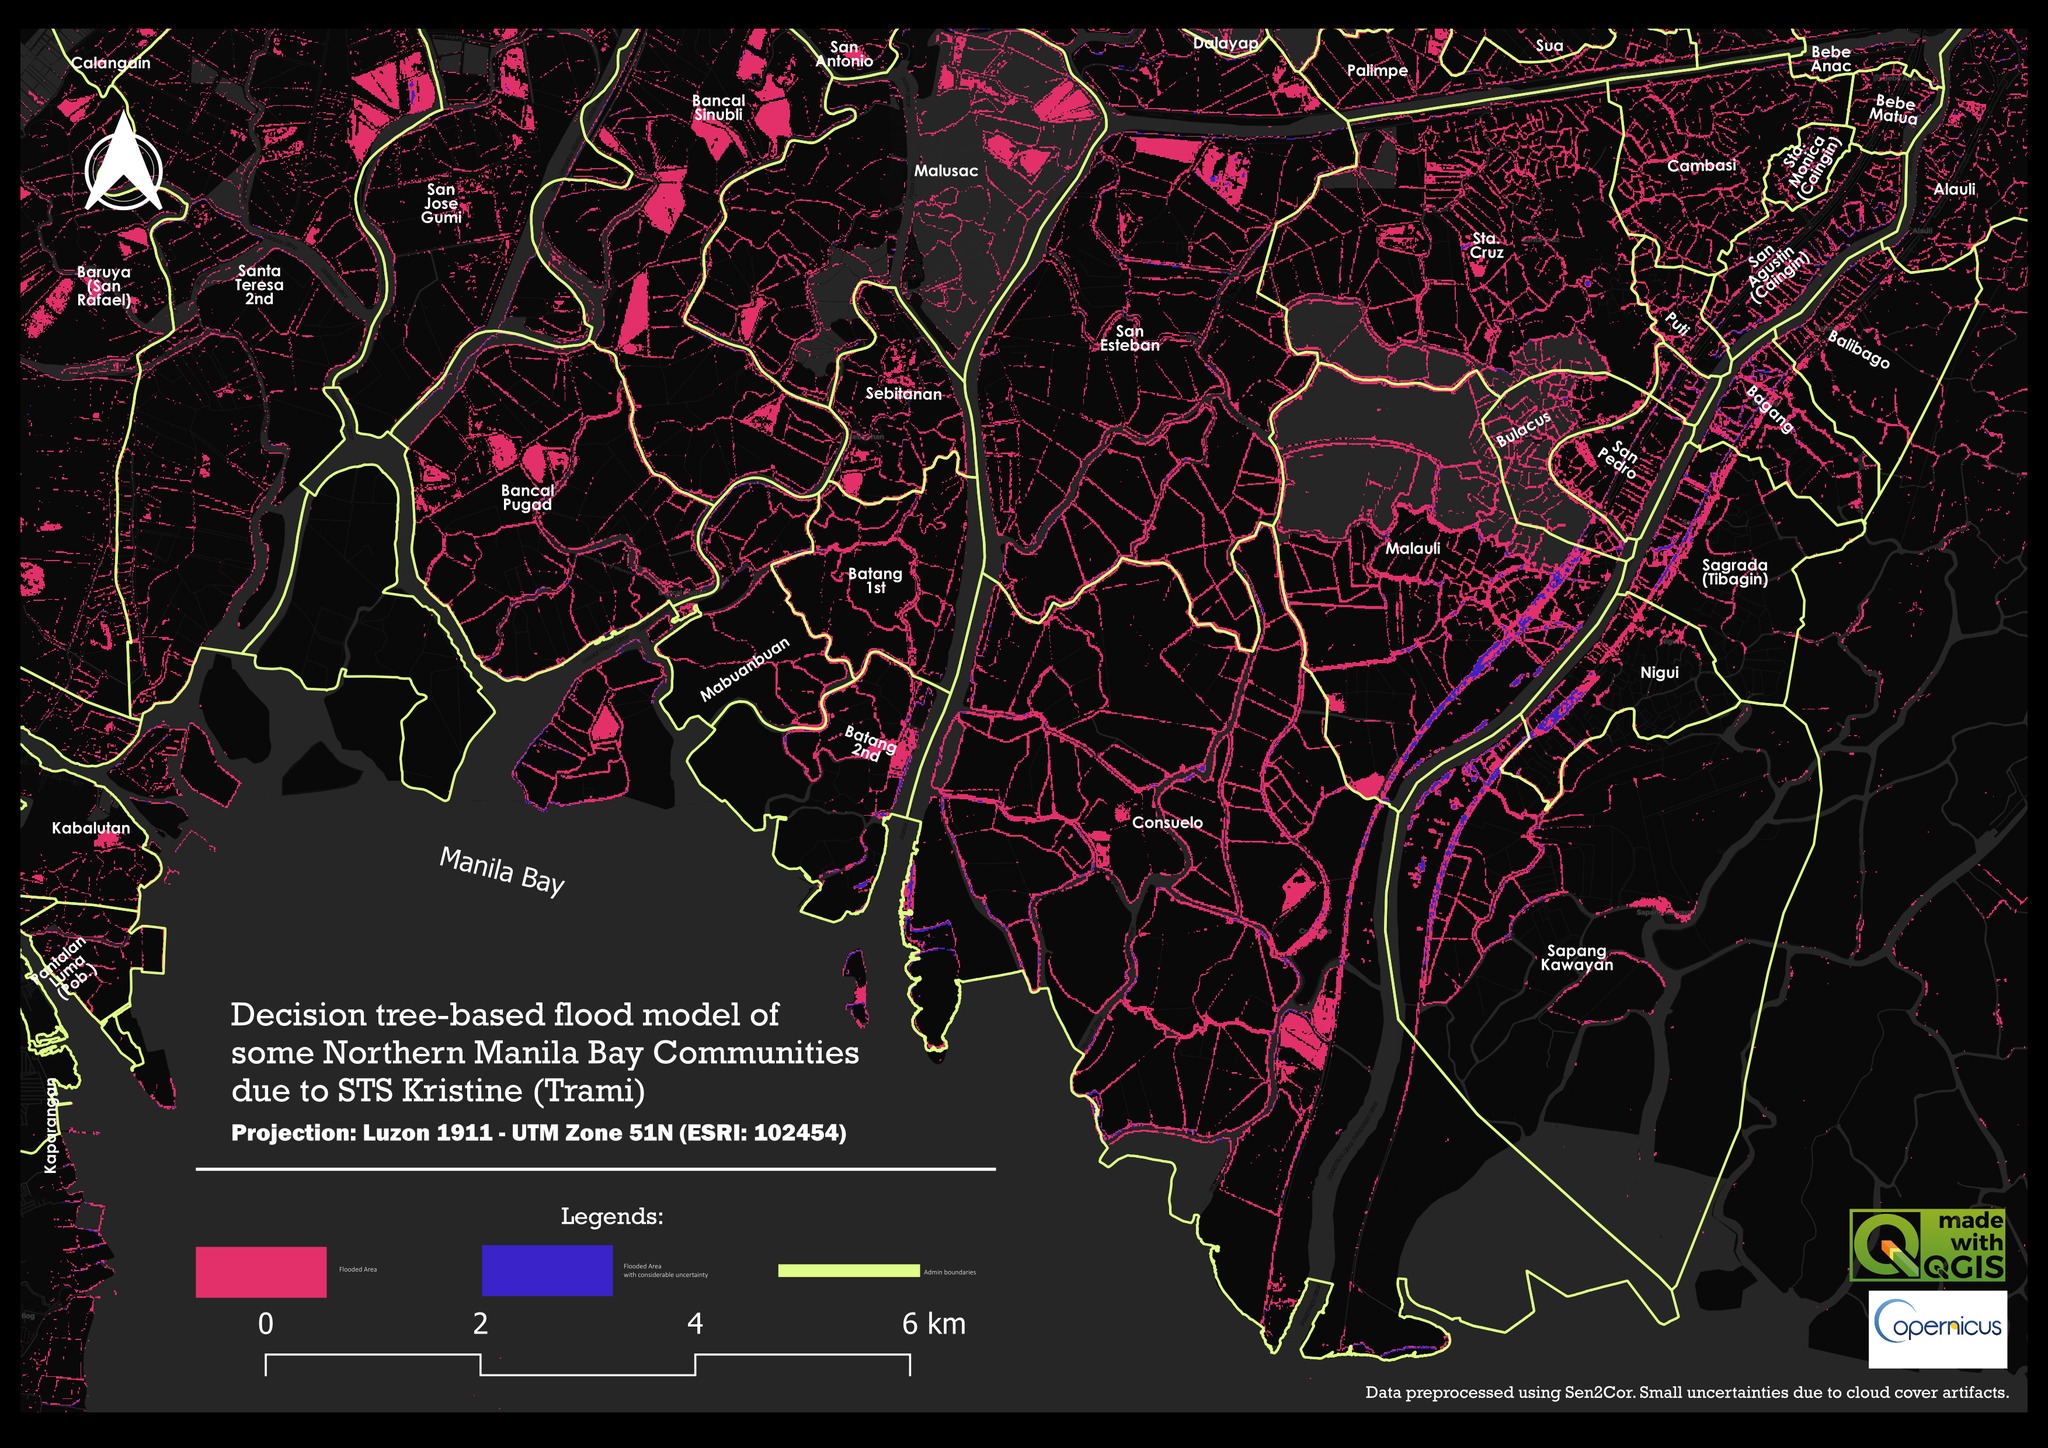
Flood Extent Map due to STS Kristine [Oct, 2024]
Decided to create simple models to visualize the aftermath of STS Kristine with different approach compared to PhilSa Map on my free time. I tried modelling some Northern Manila Bay Region Barangays (Areas of Lubao, Masantol, Macabebe, Sasmuan, and Orani) affected by the storm using Decision Tree Algorithm. Datasets used were from remotely sensed Sentinel-2 data dated Oct. 18 and Oct. 28 while the Admin Boundary was from NAMRIA.
[VIDEO] Influence of dominant wind direction on the CO₂ dispersion modeled from Vehicle Emission
We utilized gaussian plume dispersion function to map out the dispersion dynamics and extent of CO₂ in Zaragoza, Nueva Ecija. We use python numpy to carry out matrix operations and apply GPD models while also creating a simple command line interface to streamline the process. Our output shows calculated CO₂ extent from 2013 to 2018.
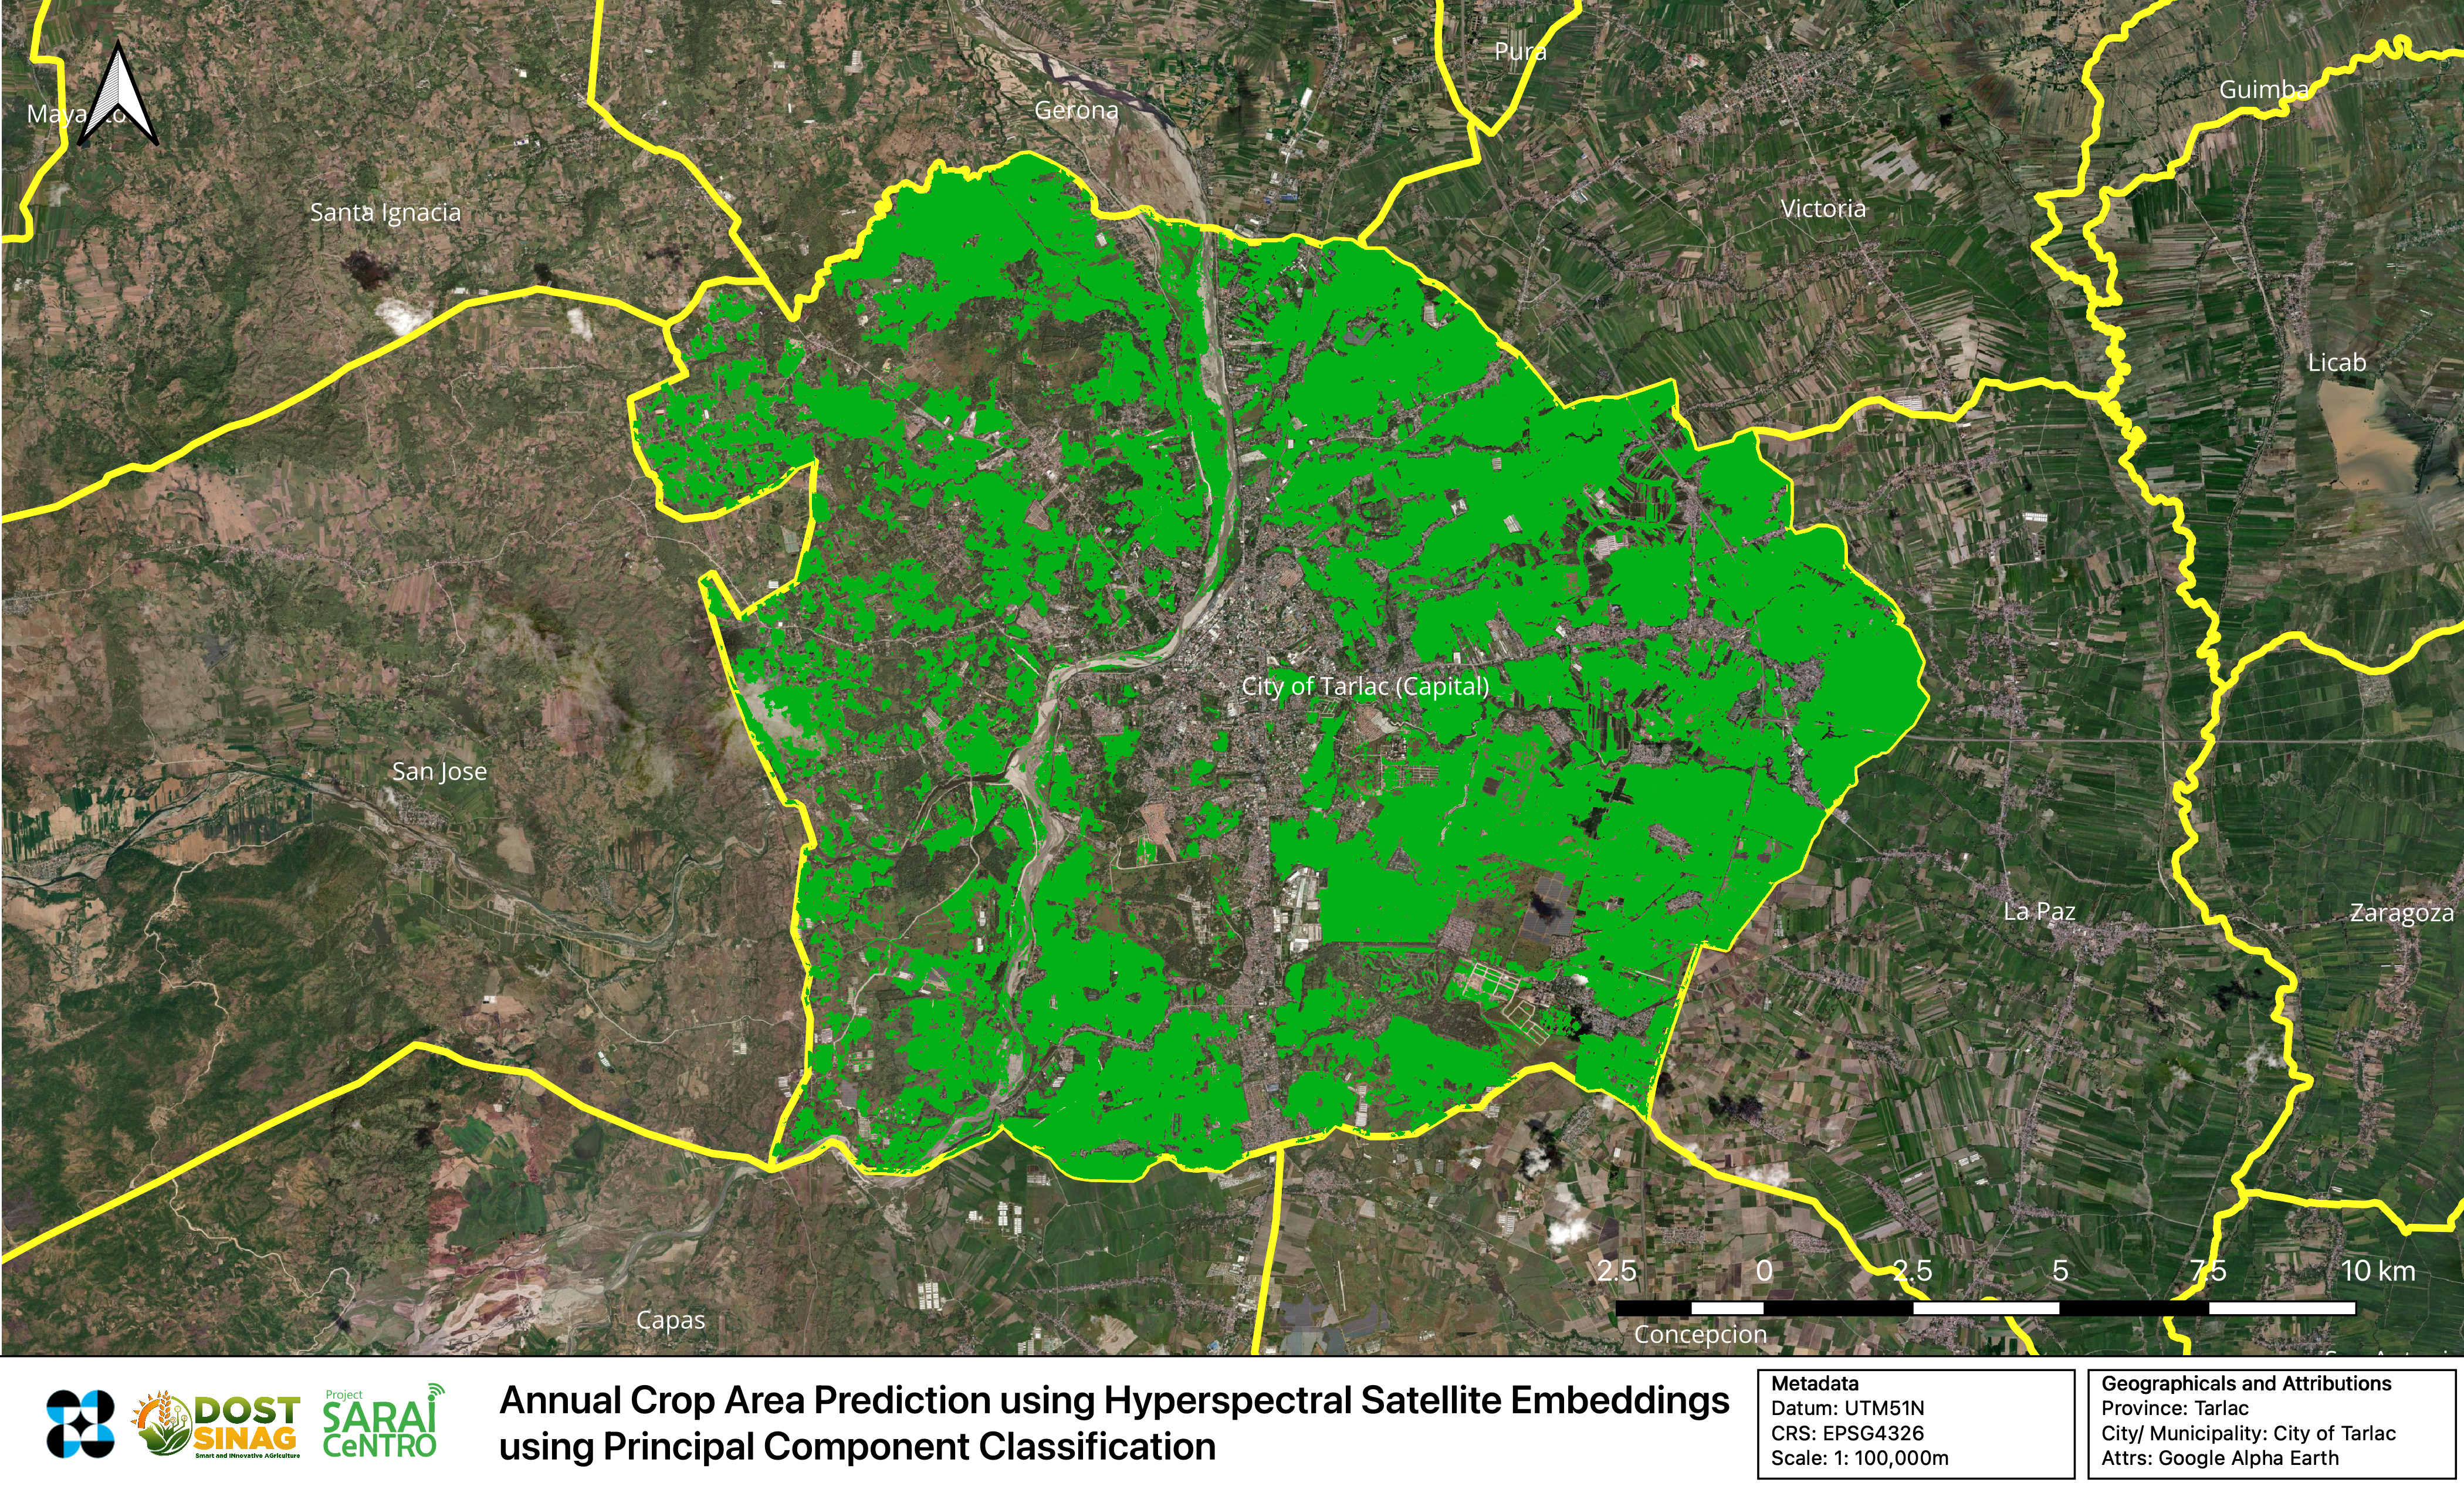
Machine Learning Based Crop Delineation
The map displays the output of an automated classification pipeline designed to delineate annual crop areas in Tarlac City using advanced geospatial analytics. By leveraging hyperspectral satellite embeddings, the model moves beyond traditional RGB imagery to analyze hundreds of narrow spectral bands that capture the unique biochemical signatures of vegetation. These high-dimensional datasets are processed using Principal Component Classification to reduce noise and isolate the most significant spectral features for land-use identification. The resulting bright green overlays represent the predicted extent of annual crops, providing a high-resolution tool for monitoring agricultural productivity and assisting local government units in data-driven land-use planning. This integration of machine learning and remote sensing demonstrates a scalable approach to digitizing agricultural inventory and supporting regional food security initiatives. This are just one of the seven partners with SARAI DOST Central Luzon. We also created one for other Central Luzon provinces.
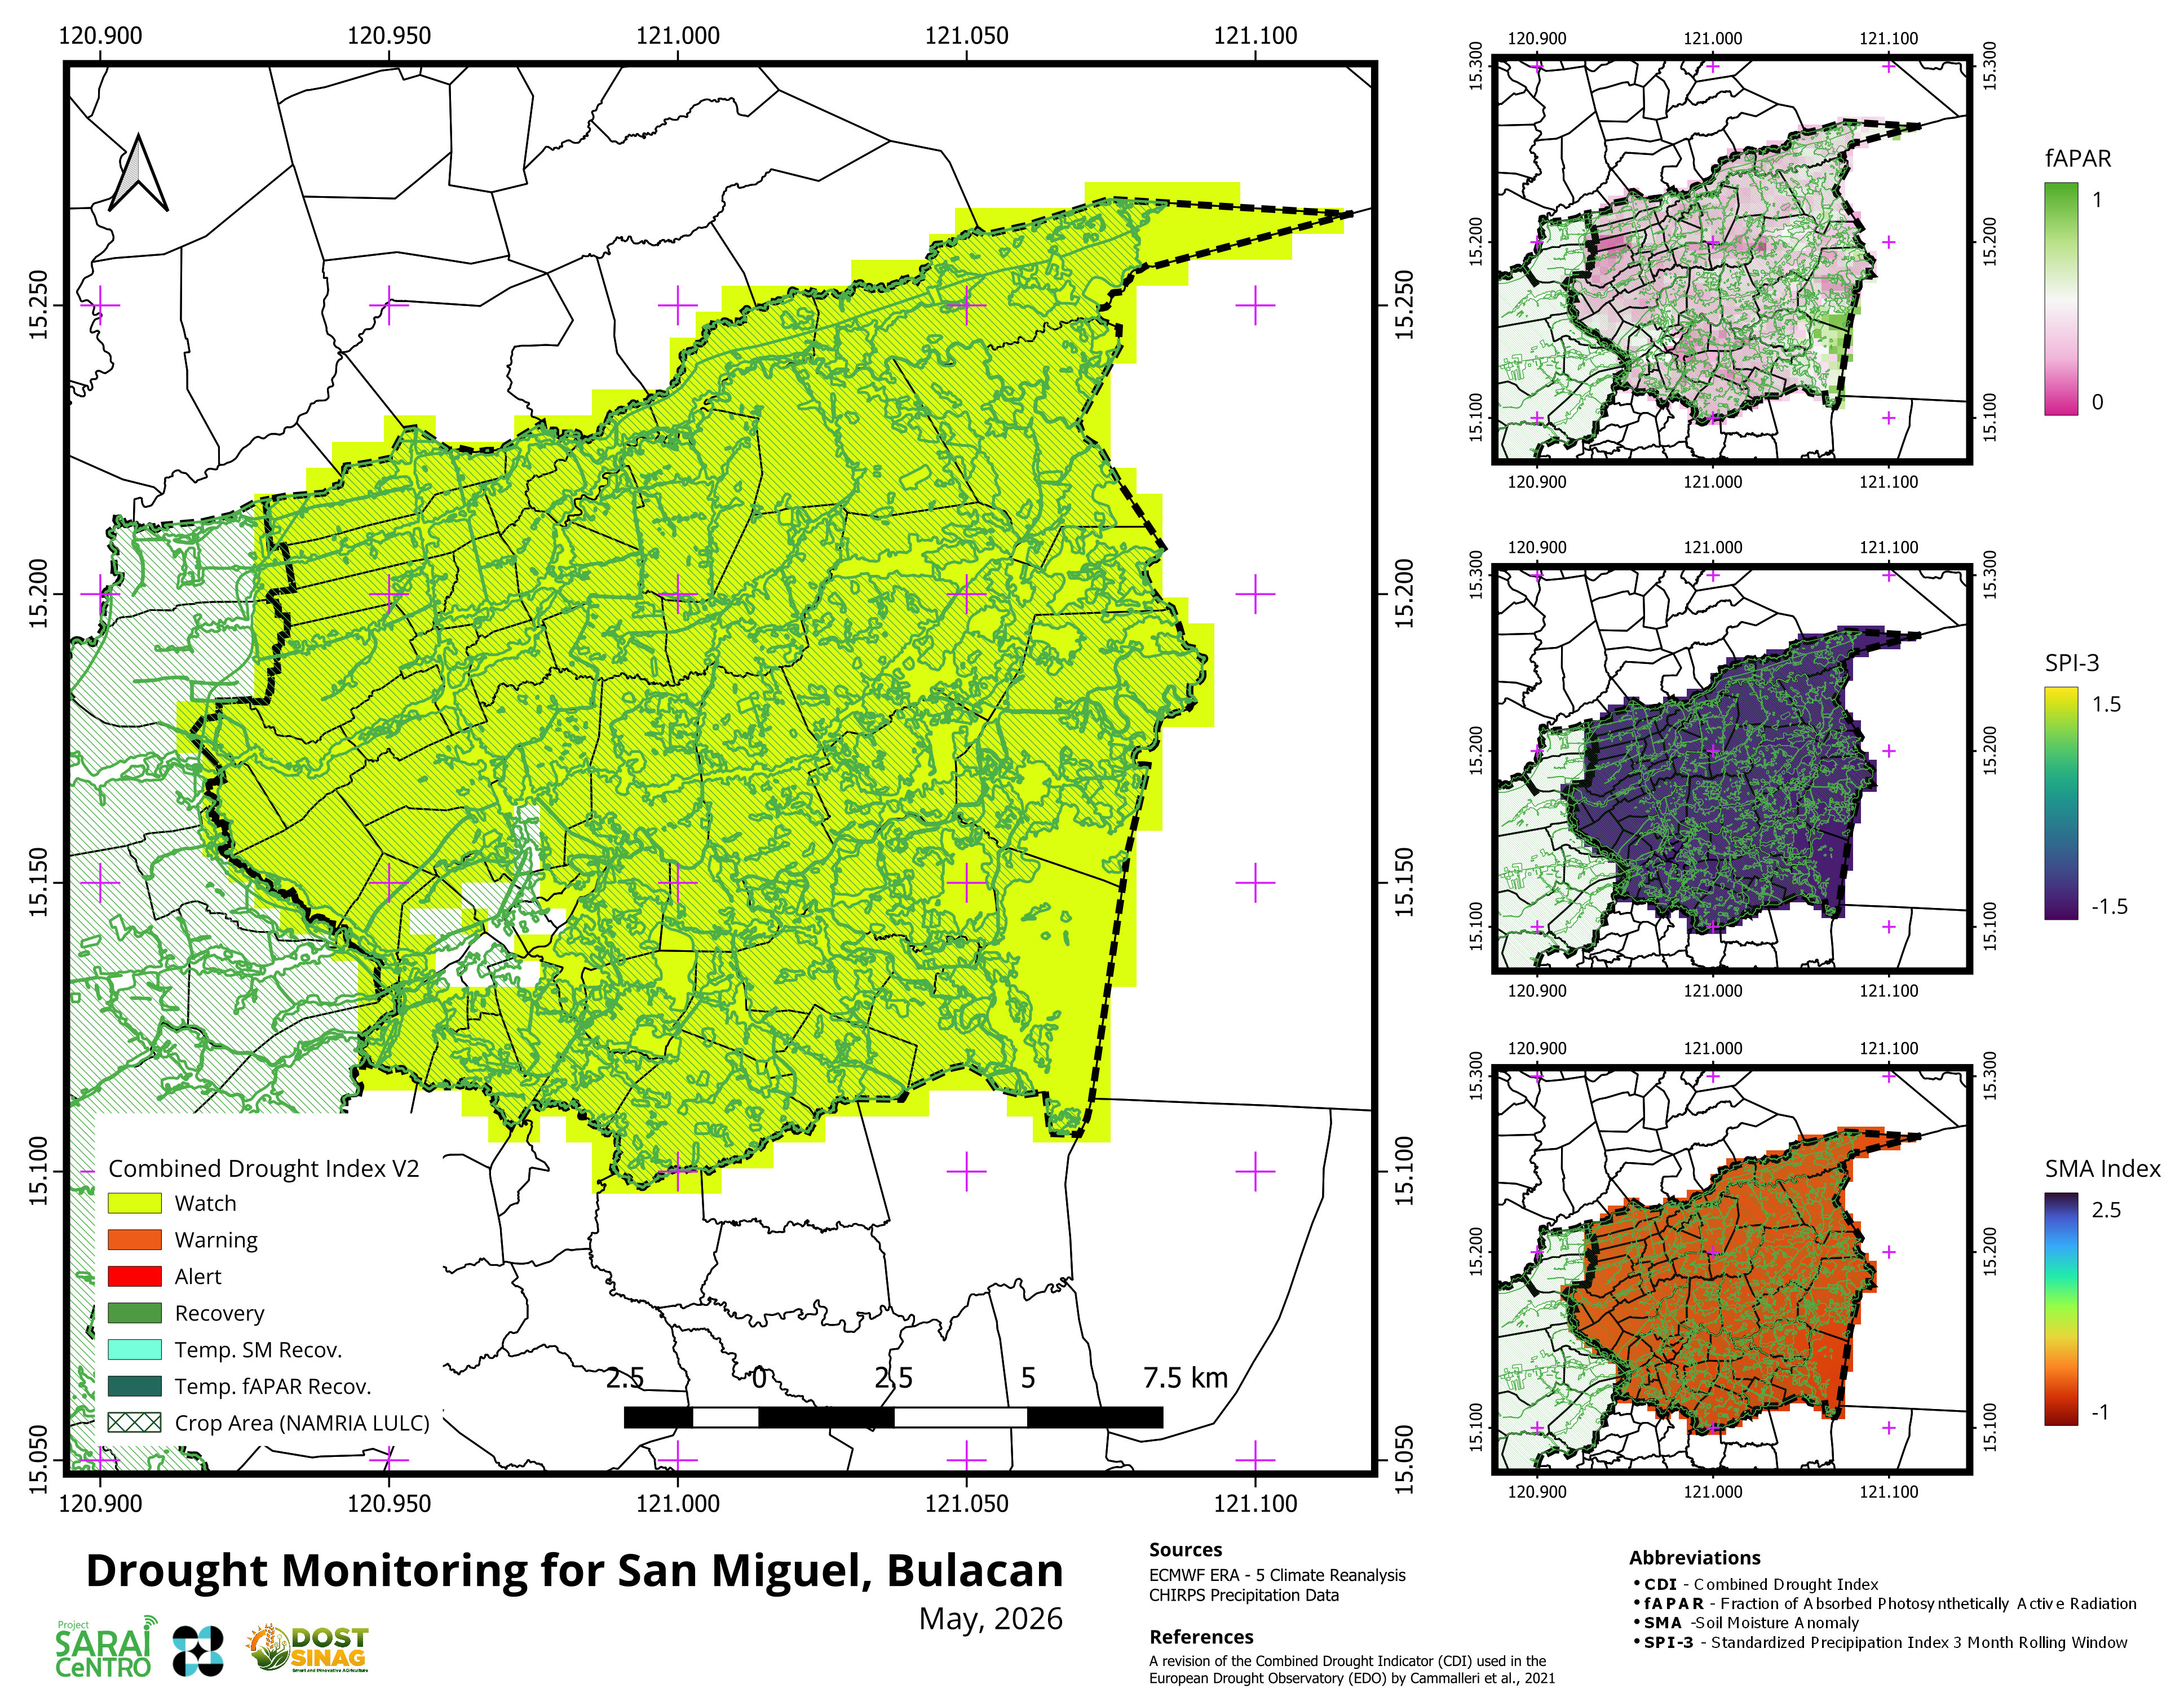
SINAG Drought Monitoring using Enhanced CDI Adopted from European Drought Observatory
The Drought Monitoring profile for San Miguel, Bulacan, showcases the enhanced Combined Drought Index (CDI) V2 framework developed to support agricultural resilience for our seven partner municipalities. This system integrates three critical indicators to provide a holistic view of environmental stress: the Standardized Precipitation Index (SPI-3) for rainfall deficits, Soil Moisture Anomaly (SMA) for ground-level water availability, and the Fraction of Absorbed Photosynthetically Active Radiation (fAPAR) to monitor actual vegetation health. By converging these datasets, the model generates precise early-warning classifications—ranging from Watch to Alert—specifically for areas identified as active crop lands. Beyond this sample for San Miguel, identical monitoring profiles were established for our partners in Dingalan, Science City of Muñoz, Candaba, Iba, Tarlac City, and Balanga, providing local government units with the data-driven insights necessary for proactive climate adaptation and food security planning. This project leverages GEE API and GIS Capabilities of Python. All processes are computationally done using custom ad-hoc script based on eCDI Documentation